Mergers and acquisitions (M&A) are among the most complex transformations in an enterprise lifecycle, reshaping everything from financials to culture. Yet, no piece of work influences business continuity more during integration than IT consolidation.
When two organizations combine into one operating model, IT migration and integration efforts—whether email, collaboration, endpoint management, security, or applications—directly determine how seamless or disruptive the M&A feels for employees. To gauge the health and success of M&A IT integration, leadership must use clear KPIs (Key Performance Indicators) and measurable metrics.
This blog explores how to define, measure, and optimize IT integration success in M&A, with a spotlight on endpoint/device migration using Opsole Migrate for Windows 10/11 and Opsole Migration Services—an end-to-end service approach covering planning through optimization.
Why IT Integration Measurement Matters in M&A
Successful IT integration goes beyond moving workloads—it ensures:
- Continuity: Employees remain productive without extended downtime.
- Security: Devices and data remain compliant throughout migration.
- Value Realization: Synergy promises of the M&A deal are actually achieved.
Without KPIs and metrics, CIOs risk “flying blind” in integration programs. Anecdotal success isn’t enough—boards and stakeholders demand quantitative proof that M&A technology integration is delivering value.
Core Dimensions of IT Integration Success
For most organizations, IT integration measurement can be broken into six primary domains:
- End-User Experience & Productivity
- Device Migration Success Rates
- Application & Data Access Continuity
- Security & Compliance Posture
- Timeline & Cost Adherence
- Optimization & Continuous Improvement
Let’s explore the KPIs and metrics within each domain.
1. End-User Experience & Productivity
KPI: Minimal downtime per employee
- Metric: Average hours of downtime per user during migration.
- Target: < 2 hours for endpoint migrations.
KPI: User Satisfaction Score (USS)
- Captured through surveys post-migration.
- Example metric: % of users rating migration 4/5 or higher for smoothness.
KPI: Ticket Volume
- Metric: Number of support tickets opened per 100 migrated devices.
- Lower tickets → higher integration readiness and proper employee communication.
💡 How Opsole Adds Value:
- Opsole Migrate tool enables seamless Windows 10/11 device migration with minimal user disruption.
- Opsole experts design communication packs and post-migration support workflows, cutting ticket volumes drastically.
2. Device Migration Success Rates
For modern workplaces, endpoints are the front line of productivity.
KPI: Device Migration Completion Rate
- Metric: % of devices successfully migrated vs. devices attempted.
- Target: > 98% completion within set pilot/rollout plan.
KPI: Re-Enrollment Error Rates (for Intune/MEM or Entra ID)
- Measuring failed or incomplete MDM re-enrollments.
💡 How Opsole Adds Value:
- Opsole Migrate automates Windows device re-provisioning, profile migration, and application re-deployment, ensuring higher FTSR.
- Opsole Migration Services manage end-to-end logistics—inventory, scheduling, re-enrollment scripts—ensuring migration metrics are achieved.
3. Application & Data Access Continuity
Applications, email, Teams, and OneDrive are lifelines for employees.
KPI: App Availability on Day 1
- Metric: % of critical business apps accessible immediately post migration.
- Target: > 95%.
KPI: File Synchronization Success
- Metric: % of files retained/synced correctly post OneDrive or SharePoint migration.
KPI: Re-Authentication Prompts
- Tracking average extra login prompts seen by users post-migration (MFA fatigue).
💡 How Opsole Adds Value:
- Opsole Migration Services include pre-migration application mapping and post-migration smoke testing, ensuring applications and data are instantly ready for employees.
4. Security & Compliance Posture
Integrations are moments of vulnerability. Measurement here reassures executives and regulators.
KPI: Compliance Posture Retention
- Metric: % of devices remaining compliant with security baselines post-migration (BitLocker,LAPS, AV, OS patch level).
- Target: 100%.
KPI: Conditional Access Success
Metric: % of users able to pass CA policies correctly post migration.
KPI: Security Incident Rate
- Tracking number of security escalations directly linked to misconfigured migrations.
💡 How Opsole Adds Value:
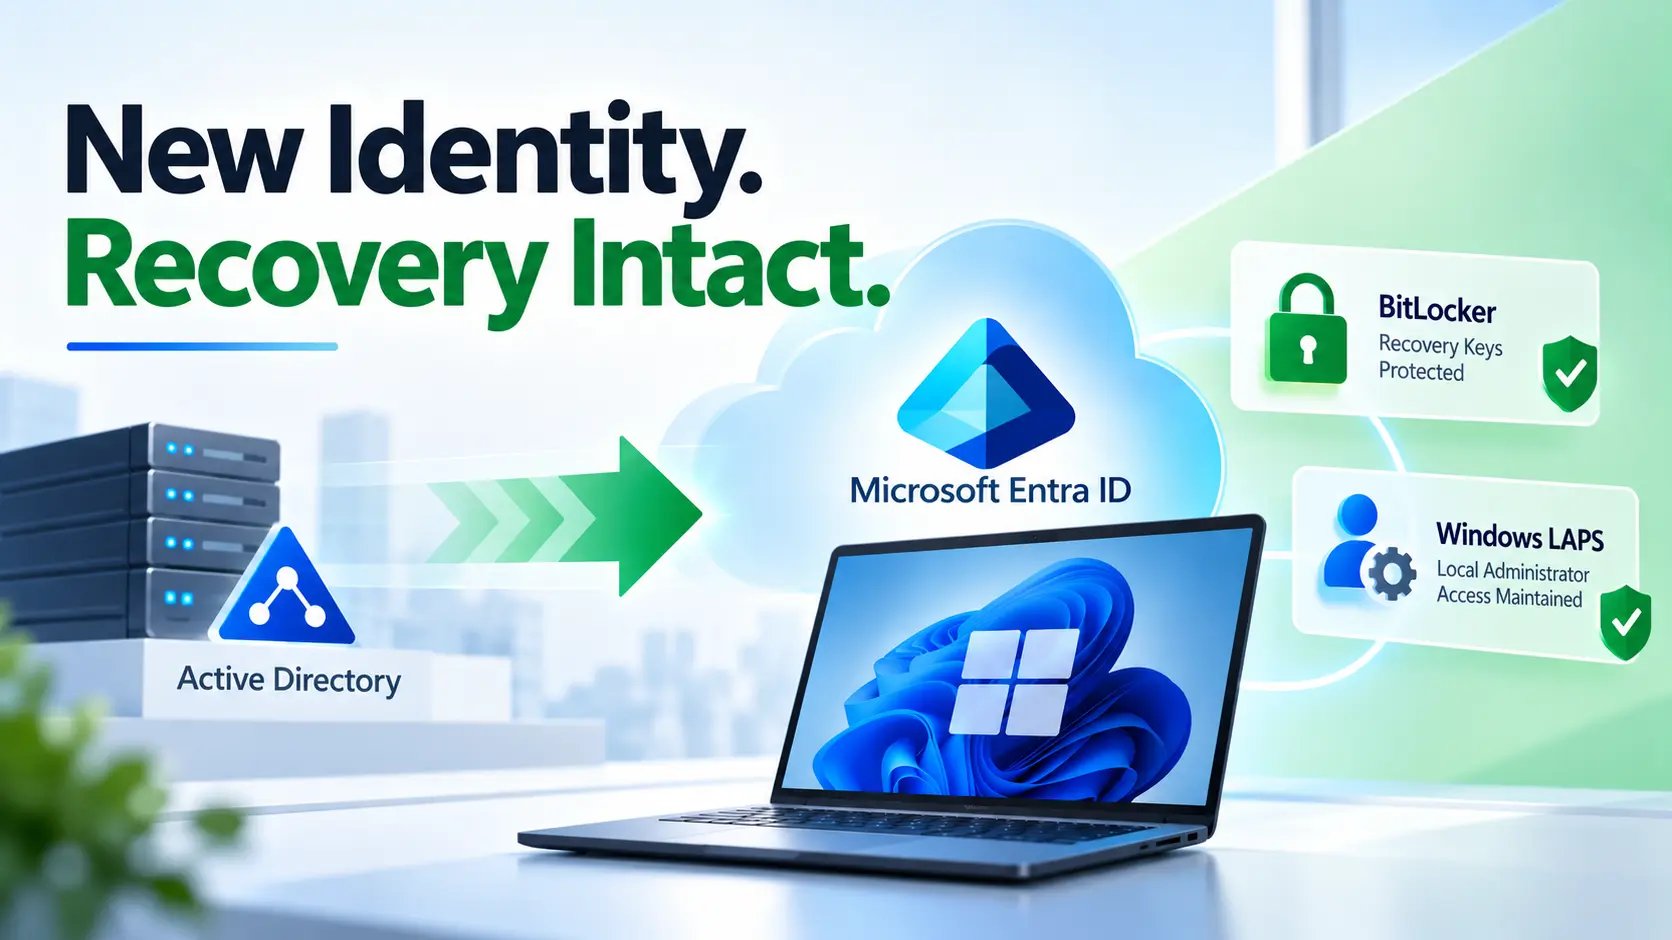
- Opsole Migrate streamlines joining devices cleanly into target Entra ID + Intune with compliance settings intact.
- Experts validate conditional access scenarios pre and post migration.
5. Timeline & Cost Adherence
Executives demand evidence that integration stays on budget and on schedule.
KPI: Migration Wave Completion vs. Plan
- Metric: % of scheduled migration waves completed on time.
KPI: Cost Per Device
- Metric: Average migration cost per device.
- Important for validating OpEx savings in M&A business case.
KPI: Variance vs. Budget
- Metric: Percentage deviation from planned cost/time baseline.
💡 How Opsole Adds Value:
- Through structured methodology, Opsole Migration Services reduce surprises and unplanned costs.
- Pre-integration planning avoids “firefighting costs” typical in less coordinated M&A migrations.
6. Optimization & Continuous Improvement
Beyond Day 1, success is about sustained performance.
KPI: Helpdesk Ticket Reduction Trend
- Metric: Migration-related ticket volume decline over 30/60/90 days.
KPI: Endpoint Analytics Improvement
- Measuring device performance (boot time, logon time) pre- and post-migration.
KPI: User Adoption Metrics
Metric: Usage of new collaboration apps, cross-tenant Teams chats, SharePoint/OneDrive adoption growth.
💡 How Opsole Adds Value:
- After cutover, Opsole Migration Services include post-migration optimization, capturing analytics, tuning security, and evolving policies.
- Ensures IT remains aligned, not just operational, but continuously optimal.
Reporting Framework: How to Structure IT Integration Metrics
For CIO dashboards, metrics should be reported in 3 levels:
- Executive KPIs (Board Level)
- % devices migrated successfully
- % user productivity restored on Day 1
- Cost vs. budget adherence
- Operational Metrics (IT Leadership Level)
- Re-enrollment success rates
- Conditional access pass/fail
- Application availability %
- Support Metrics (Service Desk Level)
- Ticket trends
- MFA re-auth prompts
- Device analytics baseline
By layering KPIs, organizations ensure everyone from executives to IT engineers has visibility at the right level.
Case for Opsole Migrate & Migration Services in KPIs
In real-world M&A, CIOs often ask: “How do we actually deliver these outcomes without overruns?”
That’s where Opsole Migrate + Migration Services stand out:
- Opsole Migrate Tool: Purpose-built for Windows 10/11 device migration, ensuring seamless re-enrollment, application provisioning, profile preservation, and policy compliance.
- Opsole Migration Services: Expert consultancy that takes the customer through planning → execution → end-user support → optimization.
This dual approach ensures organizations not only hit KPI targets but surpass benchmarks. Customers benefit from:
- Pilot & scale model built into methodology.
- Seamless communication planning ensuring user satisfaction KPIs are measured and achieved.
- Post-migration optimization tied into endpoint analytics, ensuring organizations continuously refine security and productivity.
In short, Opsole’s tool + service model = measurable success in M&A IT integration.
Example KPI Dashboard Post-M&A IT Migration
| Domain | KPI | Target | Result After Opsole Deployment |
| Productivity | Avg downtime per user | < 2 hrs | 1.2 hrs |
| Device Migration | Completion rate | > 98% | 99.4% |
| Security | Compliance posture retention | 100% | 100% |
| Applications | Critical apps available on Day 1 | > 95% | 97% |
| Support | Tickets per 100 devices migrated | < 5 | 3 |
| Optimization | Endpoint logon time improvement | > baseline | 15% faster logon |
KPIs like these provide executive assurance that the IT integration in M&A is not just delivered, but successful.
Conclusion
Measuring IT integration success in mergers and acquisitions is no longer optional—it is a strategic imperative. End-user productivity, device migration success rates, application continuity, security posture, and adherence to budget all serve as the KPIs that define integration success.
Using tools like Opsole Migrate for endpoint device migrations and relying on Opsole Migration Services for full lifecycle support ensures that these KPIs are not only met but exceeded. In M&A, where employee trust and business continuity are on the line, measured IT integration = deal value realization.
The message to CIOs and IT leaders is clear: if you can’t measure it, you can’t prove it—and if you can’t prove it, you can’t claim integration success.